Note
Go to the end to download the full example code
Sparse Subspace Clustering - OMP
This example demonstrates the sparse subspace clustering algorithm via orthogonal matching pursuit.
Configure JAX to work with 64-bit floating point precision.
from jax.config import config
config.update("jax_enable_x64", True)
Let’s import necessary libraries
from jax import random
import jax.numpy as jnp
import cr.nimble as cnb
import cr.sparse.data as crdata
import cr.nimble as cnb
import cr.nimble.subspaces
# clustering related
import cr.sparse.cluster.spectral as spectral
import cr.sparse.cluster.ssc as ssc
# Plotting
import matplotlib.pyplot as plt
# evaluation
import sklearn.metrics
# Some PRNGKeys for later use
key = random.PRNGKey(0)
keys = random.split(key, 10)
Problem configuration
Test data preparation
Construct orthonormal bases for K subspaces
Measure angles between subspaces in degrees
angles = cnb.subspaces.smallest_principal_angles_deg(bases)
Print the minimum angle between any pair of subspaces
print(cnb.off_diagonal_min(angles))
47.44974475121892
Generate uniformly distributed points on each subspace
Assign true labels to each point to corresponding subspace index
true_labels = jnp.repeat(jnp.arange(K), S)
print(true_labels)
[0 0 0 0 0 0 0 0 0 0 0 0 0 0 0 0 0 0 0 0 0 0 0 0 0 0 0 0 0 0 0 0 0 0 0 0 0
 0 0 0 0 0 0 0 0 0 0 0 0 0 1 1 1 1 1 1 1 1 1 1 1 1 1 1 1 1 1 1 1 1 1 1 1 1
 1 1 1 1 1 1 1 1 1 1 1 1 1 1 1 1 1 1 1 1 1 1 1 1 1 1 2 2 2 2 2 2 2 2 2 2 2
 2 2 2 2 2 2 2 2 2 2 2 2 2 2 2 2 2 2 2 2 2 2 2 2 2 2 2 2 2 2 2 2 2 2 2 2 2
 2 2 3 3 3 3 3 3 3 3 3 3 3 3 3 3 3 3 3 3 3 3 3 3 3 3 3 3 3 3 3 3 3 3 3 3 3
 3 3 3 3 3 3 3 3 3 3 3 3 3 3 3 4 4 4 4 4 4 4 4 4 4 4 4 4 4 4 4 4 4 4 4 4 4
 4 4 4 4 4 4 4 4 4 4 4 4 4 4 4 4 4 4 4 4 4 4 4 4 4 4 4 4]
Total number of data points
250
Sparse Subspace Clustering Algorithm
Build representation of each point in terms of other points by using Orthogonal Matching Pursuit algorithm
Z, I, R = ssc.build_representation_omp_jit(X, D)
Combine values and indices to form full representation
Z_full = ssc.sparse_to_full_rep(Z, I)
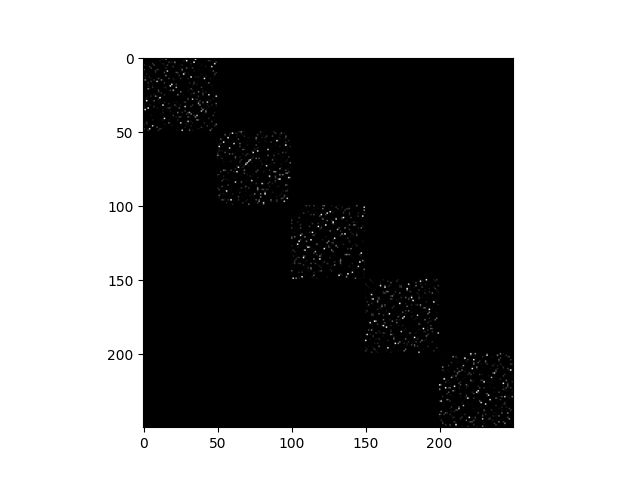
Build the affinity matrix
affinity = abs(Z_full) + abs(Z_full).T
plt.imshow(affinity, cmap='gray')

<matplotlib.image.AxesImage object at 0x7f1ff9fb9b80>
Perform the spectral clustering on the affinity matrix
res = spectral.unnormalized_k_jit(keys[2], affinity, K)
Predicted cluster labels
pred_labels = res.assignment
print(pred_labels)
[1 1 1 1 1 1 1 1 1 1 1 1 1 1 1 1 1 1 1 1 1 1 1 1 1 1 1 1 1 1 1 1 1 1 1 1 1
 1 1 1 1 1 1 1 1 1 1 1 1 1 4 4 4 4 4 4 4 4 4 4 4 4 4 4 4 4 4 4 4 4 4 4 4 4
 4 4 4 4 4 4 4 4 4 4 4 4 4 4 4 4 4 4 4 4 4 4 4 4 4 4 2 2 2 2 2 2 2 2 2 2 2
 2 2 2 2 2 2 2 2 2 2 2 2 2 2 2 2 2 2 2 2 2 2 2 2 2 2 2 2 2 2 2 2 2 2 2 2 2
 2 2 3 3 3 3 3 3 3 3 3 3 3 3 3 3 3 3 3 3 3 3 3 3 3 3 3 3 3 3 3 3 3 3 3 3 3
 3 3 3 3 3 3 3 3 3 3 3 3 3 3 3 0 0 0 0 0 0 0 0 0 0 0 0 0 0 0 0 0 0 0 0 0 0
 0 0 0 0 0 0 0 0 0 0 0 0 0 0 0 0 0 0 0 0 0 0 0 0 0 0 0 0]
Evaluate the clustering performance
print(sklearn.metrics.rand_score(true_labels, pred_labels))
1.0
SSC-OMP with shuffled data
Choose a random permutation
perm = random.permutation(keys[3], total)
Randomly permute the data points
X = X[:, perm]
# Permute the true labels accordingly
true_labels = true_labels[perm]
print(true_labels)
[0 3 2 2 1 4 0 0 3 3 0 3 4 2 4 3 3 0 2 1 3 4 1 3 0 2 4 1 0 4 2 2 3 0 2 4 3
 3 0 0 1 0 4 3 1 1 4 4 1 1 2 4 1 0 3 4 1 4 0 1 1 2 0 1 3 0 3 4 0 0 4 1 1 1
 3 2 4 0 2 3 3 1 2 3 2 1 1 4 3 4 2 0 0 4 4 1 4 0 2 2 0 4 4 2 0 1 1 1 4 1 2
 2 4 2 0 0 4 2 1 0 2 3 3 3 1 3 4 3 0 4 3 4 2 1 3 3 4 3 4 3 1 4 4 2 0 0 1 1
 1 1 1 3 3 4 2 1 2 1 4 4 3 2 3 0 0 1 4 1 0 4 3 1 1 2 3 1 2 0 0 2 4 2 2 2 2
 0 3 3 1 0 3 2 0 4 0 0 4 4 0 1 0 1 1 4 3 3 1 3 2 2 3 0 4 2 4 3 2 3 0 3 2 3
 3 0 4 2 0 2 2 4 0 2 1 2 1 0 3 0 3 2 1 0 2 1 4 4 2 0 2 4]
Build representation of each point in terms of other points by using Orthogonal Matching Pursuit algorithm
Z, I, R = ssc.build_representation_omp_jit(X, D)
Combine values and indices to form full representation
Z_full = ssc.sparse_to_full_rep(Z, I)
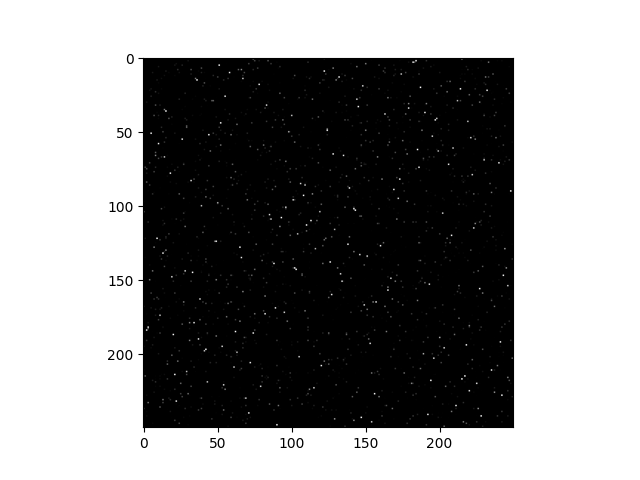
Build the affinity matrix
affinity = abs(Z_full) + abs(Z_full).T
plt.imshow(affinity, cmap='gray')

<matplotlib.image.AxesImage object at 0x7f1ff343be50>
Perform the spectral clustering on the affinity matrix
res = spectral.unnormalized_k_jit(keys[4], affinity, K)
Predicted cluster labels
pred_labels = res.assignment
print(pred_labels)
[3 0 1 1 2 4 3 3 0 0 3 0 4 1 4 0 0 3 1 2 0 4 2 0 3 1 4 2 3 4 1 1 0 3 1 4 0
 0 3 3 2 3 4 0 2 2 4 4 2 2 1 4 2 3 0 4 2 4 3 2 2 1 3 2 0 3 0 4 3 3 4 2 2 2
 0 1 4 3 1 0 0 2 1 0 1 2 2 4 0 4 1 3 3 4 4 2 4 3 1 1 3 4 4 1 3 2 2 2 4 2 1
 1 4 1 3 3 4 1 2 3 1 0 0 0 2 0 4 0 3 4 0 4 1 2 0 0 4 0 4 0 2 4 4 1 3 3 2 2
 2 2 2 0 0 4 1 2 1 2 4 4 0 1 0 3 3 2 4 2 3 4 0 2 2 1 0 2 1 3 3 1 4 1 1 1 1
 3 0 0 2 3 0 1 3 4 3 3 4 4 3 2 3 2 2 4 0 0 2 0 1 1 0 3 4 1 4 0 1 0 3 0 1 0
 0 3 4 1 3 1 1 4 3 1 2 1 2 3 0 3 0 1 2 3 1 2 4 4 1 3 1 4]
Evaluate the clustering performance
print(sklearn.metrics.rand_score(true_labels, pred_labels))
1.0
Total running time of the script: (0 minutes 5.495 seconds)
